# Industrial heat pumps: how to evaluate a project
An industrial heat pump becomes worth considering when an available heat source can supply a hotter process at the times the plant needs it. The project is assessed on the useful heat delivered and the total electricity consumed. The machine’s maximum temperature and its coefficient of performance in a catalogue are not enough to choose an installation.
Four questions organise the evaluation: what heating service is required, how can its temperature be raised, which solution provides it at the best total cost, and which measurements will verify the result? This article explains the mechanisms, then tests a fictional calculation against two practical difficulties: energy prices and the mismatch between the operating hours of the source and the heat demand.
The numerical examples are illustrative; they are not supplier quotations or findings from factory visits. The industrial Transpac case is reported by EDF; its scope remains separate from the fictional scenario. Keeping them apart makes it possible to understand what the technology can do without assigning results to another site that has not yet demonstrated them.
*Conceptual illustration of heat transfer, without machine sizing.*
## Contents
[Demand](#define-the-demand) · [Mechanism](#understand-the-mechanism) · [Performance](#read-the-performance-data) · [Alternatives](#compare-the-alternatives) · [Scenario](#calculate-a-scenario) · [Evidence](#prepare-the-evidence) · [Decision](#decide-between-measuring-studying-testing-and-investing) · [Questionnaire](#self-assessment-questionnaire)
## Define the demand
A factory does not buy only a quantity of energy. It needs to sustain an operation: drying a material, cleaning equipment, heating a bath or supplying steam. Temperature, power, duration and fluid quality are all part of that service. Abundant heat arriving after the end of a shift does not automatically replace the fuel consumed during the shift. Nor does hot water replace steam needed for an operation without checking the process conditions.
Starting with the equipment available therefore reverses the approach. The demand must be described at the point that matters for production, together with its permissible operating range. The temperature required at the product may differ from that of the distribution network and the existing boiler. An older installation may distribute steam at one uniform level to workshops with different needs. The analysis separates those uses without assuming in advance that all their temperatures can be lowered.
The description must also specify what happens during start-up, cleaning and changes in production. An annual average sometimes hides short but decisive sequences. If a workshop requires a rapid temperature rise after every shutdown, peak power and equipment controls become as important as annual energy. A solution that is efficient under steady conditions may then need supplementary heating, storage or a different operating arrangement.
Responsibility for the heating service must also be assigned. An unclear boundary between the plant operator, heat supplier and integrator creates conflicting expectations. Who guarantees the temperature at the delivery point? Who measures the energy, and who decides to stop the system? The answer is more than an administrative formality: it connects every promise to a measurement and every incident to an action. Without that responsibility, the project remains a technical intention that is difficult to accept and operate.
## Understand the mechanism
Heat flows spontaneously from a hotter medium to a colder one. To take it from a lukewarm waste stream and deliver it to a hotter process, a compression heat pump uses the work of a compressor. In a closed-loop design, its working fluid circulates in a circuit separate from the plant’s streams. Changing its pressure changes the temperatures at which it can absorb and then release heat. The International Energy Agency’s explanation of the principle describes this movement of heat; industrial designs adapt the components and conditions.
A simple subcritical cycle follows four operations. For a given fluid, increasing the pressure raises the phase-change temperature: the circuit uses this relationship while remaining below the critical point on the condensation side. At low pressure, the fluid evaporates in a heat exchanger, absorbing heat from the source. For that transfer to occur, its evaporation temperature must be below the temperature of the stream being cooled. The compressor draws in this vapour and raises both its pressure and temperature. The energy it consumes enters the machine’s heat balance.
On the hot side, the fluid releases heat to the process. In this cycle, it condenses at high pressure, at a temperature that allows it to heat the industrial stream. The expansion valve then reduces the liquid’s pressure, preparing its return to the evaporator. Expansion does not provide free work that cancels out the compressor’s work. It returns the fluid to conditions in which it can once again extract heat from the source.
The compressor therefore does not produce all the heat delivered. That heat combines recovered heat with the contribution of the work supplied. This is why the coefficient of performance, or COP, can exceed one: for heating, it is the ratio of heat supplied to energy consumed within the declared boundary. Heat extracted from the waste stream is not counted in the denominator. A COP of four does not mean that one unit of energy creates four; the machine also transfers energy already present in the source.
The description in terms of evaporation and condensation has a specific limit. In a transcritical cycle, the fluid can reject heat at a pressure above its critical pressure: it cools without going through the condensation stage of the previous cycle. The heat exchanger on the hot side acts as a gas cooler. This difference matters when the stream being heated rises progressively in temperature. It appears again in the Transpac case; heat pumps should not all be drawn as though they condense in the same way.
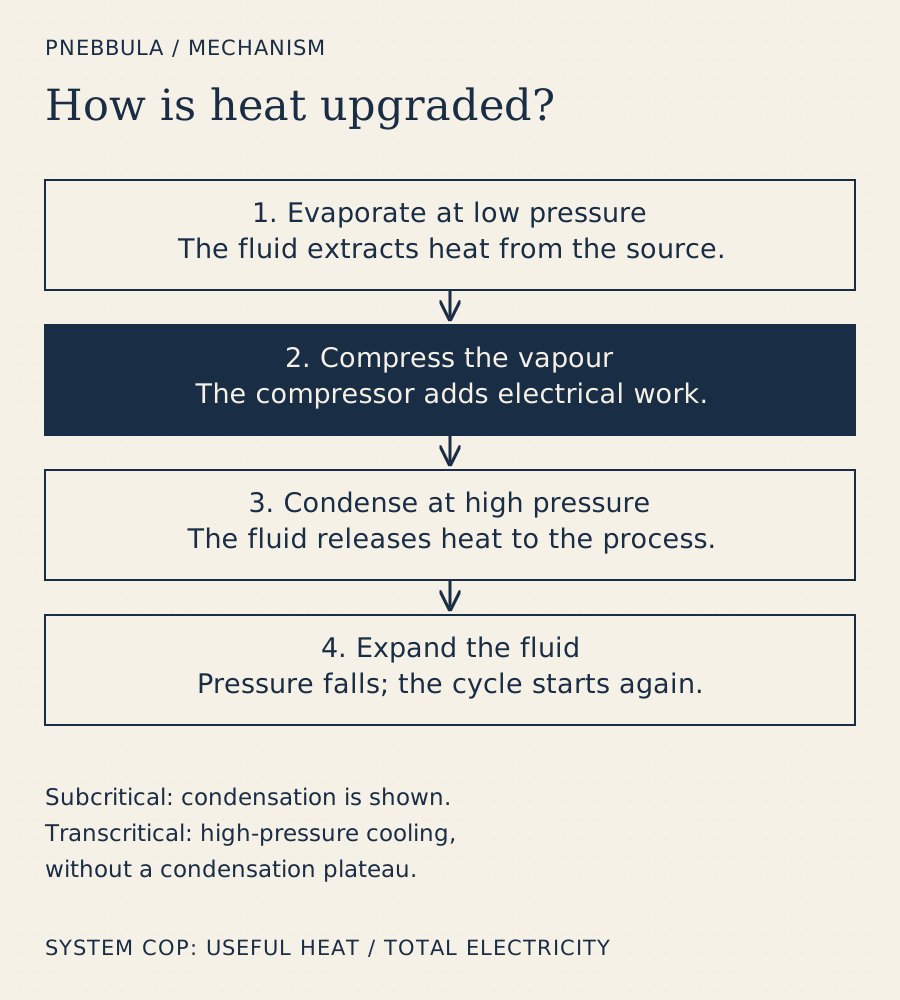
*Simplified principle: condensation describes the subcritical case; a transcritical design rejects heat differently. The boundary and auxiliary loads must be specified for each offer.*
### Ask for all four temperatures
The term “cold source” refers to the side from which heat is extracted. That source may feel hot: it remains colder than the level at which the machine must deliver its heat. Its inlet temperature alone is not enough to describe it. As it releases energy, the stream cools; on the other side, the heated stream may warm throughout the heat exchanger. The inlet and outlet temperatures of both streams are therefore needed to describe the service.
This change during heat exchange is sometimes called a temperature glide. It is distinct from the temperature lift required of the heat pump between the source and process sides. Two installations advertising the same final temperature can have very different profiles. Gradually heating water from a low temperature to a high one does not pose exactly the same problem as keeping a bath at an almost constant temperature, even if both uses have the same number on their specification sheet.
Heat exchangers introduce another constraint: to transfer heat at a given rate, a temperature difference must remain between the fluids. Fouling or insufficient heat-transfer area can force the machine to work with a less favourable difference. The compressor must then do more work, or useful output falls. Cleaning or resizing a heat exchanger, or lowering a setpoint where the process allows it, can therefore change the heat pump’s consumption without changing its name or nominal capacity.
The Carnot COP provides an ideal limit between two reservoirs at constant temperatures, using absolute temperatures. It helps explain why a greater temperature lift penalises performance; it does not predict the commercial COP of an installation with varying streams. The IEA HPT Annex 58, Task 4 report on specifications and testing distinguishes these ideal references from actual performance. When comparing offers, asking first for the four temperatures, flow rates, load and electrical boundary is more useful than an isolated theoretical indicator.
## Distinguish the designs before comparing COPs
A closed-loop compression heat pump circulates its own working fluid. Heat exchangers separate that fluid from the process water, air or effluents. This separation is useful when compositions differ or direct contact is ruled out. It also creates constraints on heat transfer, cleaning and temperature. The offer must show where the boundaries lie, rather than imply that all the plant’s fluids pass through the compressor.
Mechanical vapour recompression uses vapour already present in the process. By increasing its pressure, the compressor allows it to be reused at a suitable thermal level. This close connection with the process can avoid some intermediate heat exchanges. Vapour composition and entrained material then become decisive. A contaminated vapour cannot be sent into a compressor without qualifying its inlet conditions.
Start-up also distinguishes these designs. If the vapour to be recompressed exists only after production starts, another source must handle the transition. The same problem arises when a heat pump depends on a waste stream that disappears while the source workshop is being cleaned. The steady-state balance may be good while start-ups require costly supplementary heating or complex controls. The Annex 58, Task 2 integration summary places these interfaces at the centre of the analysis.
Thermally driven systems, including some absorption heat pumps, use a driving energy other than electrical work alone. Their low electricity consumption does not allow them to be ranked directly ahead of a compression machine: the driving heat must enter the balance and may have another useful destination. The DOE technical document from June 2003 explains these families of mechanisms. Its age rules out using it for a current price or market assessment. The designs must be compared for an identical service, with their own driving energies and constraints.
## Available heat is not yet recoverable heat
The first examination of a thermal stream concerns its nature. Vapour exhausts, cooling water and a waste stream carrying particles do not transfer heat in the same way. Fouling can degrade heat transfer, increase pressure losses and require cleaning. A corrosive composition or hygiene constraint may call for an intermediate heat exchanger. It protects the process but adds equipment, a temperature difference and sometimes auxiliary consumption.
The permanence of the resource must then be checked. A workshop that rejects a great deal of heat during a production campaign and then shuts down for a long period does not provide the same basis as a continuous stream. Planned works, changes in production volumes and transformations already scheduled must enter the study. Recovering heat that will disappear after another energy-efficiency improvement can lead to an oversized installation useful only during a transition.
The description “waste heat” thus raises a prior question: could its production or loss have been avoided? Reducing demand or correcting a deviation can be preferable to funding recovery. The heat pump acts on the heat that remains where recovery makes sense. The approach is not to preserve an inefficiency to feed a new machine. This hierarchy is an analytical recommendation, not a guarantee that a preliminary reduction will be enough to replace the project.
The ADEME assessment published in January 2025 estimates that, at the end of 2022, 27.9 terawatt-hours of waste heat per year were already recovered, with 90 terawatt-hours per year still to be recovered, including 85.2 in industry. These figures put the issue in context; they do not measure the potential for heat pumps alone. A destination too far away, an unsuitable temperature or incompatible operating hours can leave part of the resource unusable in a particular project. The national total therefore cannot be converted into savings available to an individual factory.
## Make the source and demand coincide
An annual total does not say whether heat is available when it can be used. Consider a fictional schedule: the source workshop operates from 06:00 to 14:00 and the receiving workshop from 10:00 to 22:00. Both operate on every day considered, but their schedules overlap only from 10:00 to 14:00, or four hours. This means neither that half of the source heat will be used nor that one third of demand will be covered. Power and temperature profiles during those hours are missing.
The first decision is to overlay the profiles. If the source reaches its useful temperature only near the end of the shift, part of the four hours may disappear. If demand peaks after 18:00, the totals can be large while providing little direct recovery. Synchronised measurement of flow rates and temperatures distinguishes these cases. Readings taken on different dates and then brought together as an “average day” can hide the mismatch that determines the project.
Storage is one option to study in this example. Heat available between 06:00 and 10:00 could be kept for later use, but the capacity required depends on the energy that can be transferred and the temperature maintained. A tank at an insufficient temperature does not provide the expected service without another conversion. Space, losses, and charging and discharging power also enter the study. Storage can shift an available stream in time; it does not create the missing heat during an extended shutdown of the source workshop.
Two paths can then be compared. The site can consider a heat pump operating mainly during the overlap and retain another heat supply for the remaining hours. It can also study wider recovery with storage and supplementary heating. The first path may leave more energy unused while requiring less equipment. The second may increase coverage at the cost of heavier integration. Choosing requires a balance of the hours actually covered, shutdowns and costs, rather than a prior preference for the most complete solution.
Sizing follows this schedule. A machine capable of absorbing a short peak risks spending much of its time at part load; a smaller machine may leave a substantial base demand to supplementary heating. The performance map and the duration of each mode make it possible to examine the trade-off. The article on [data-centre heat (in French)](https://pnebbula.com/analyses/chaleur-centre-donnees-reseau-chauffage/) encounters the same difficulty: proximity and abundance are not enough without a compatible use. For the fictional industrial project, the next action is a campaign of synchronised profiles and a study of possible storage, before a substantial heat-pump trial.
## Read the performance data
Nominal capacity states what equipment can supply under defined conditions. It does not state the useful energy it will deliver in a year. Annual delivery depends on operating hours, load, availability of the source and availability of demand. Thermal capacity can be expressed as power, while an annual saving is energy. Comparing them directly mixes the size of a tap with the amount of water that has passed through it.
COP requires the same discipline. An instantaneous value at the compressor, a value for the complete machine and a balance for the installation are not interchangeable. Circulation pumps, fans, standby consumption, distribution and supplementary heating can change total consumption. Not everything should be added indiscriminately: some equipment already existed and serves other uses. The study must explain what is included, what changes with the project and how shared consumption is allocated.
For an annual balance, add the energies and then calculate their ratio. Averaging the COPs of different modes can give a misleading value. In a fictional example, producing four thousand units of heat at a COP of four requires one thousand units of electricity; six thousand units at a COP of three require two thousand. The total is ten thousand units supplied for three thousand electrical units before auxiliaries. The resulting ratio differs from a simple average of the two performance values.
The Annex 58, Task 4 specifications and testing report recommends clarifying boundaries and using performance maps. It provides a basis for discussing an offer. A map relates performance to operating conditions; it does not certify that the factory will meet those conditions. The quality of the tests or model supporting it must still be examined, along with the area in which values are extrapolated.
| Indicator | What it describes | What must be specified | What it does not prove |
|---|---|---|---|
| Nominal thermal output | Capacity in a defined state | Temperatures, load, fluid and delivery point | Useful annual production |
| Machine COP | Heat-to-energy ratio within the declared boundary | Auxiliaries included, mode, steady conditions | Annual cost for the whole site |
| System COP | Ratio within a wider boundary | Distribution, standby, supplementary heating and allocations | Identical performance in another factory |
| Availability | Time during which the service can be provided | Definition of downtime and observation period | Quantity produced or thermal quality |
| Energy displaced | Part of the service previously supplied in another way | Baseline, comparable production, adjustments | Financial benefit without prices and full costs |
## An announcement, a test and a contract answer three questions
An announcement helps identify a solution. A test describes what a device actually produced under given conditions. A contract defines what a supplier undertakes to deliver and how a deviation will be handled. A single offer can include all three documents, but each must remain clear. The maximum temperature advertised is not necessarily a continuous test point, and the COP measured in a laboratory is not automatically the guaranteed value at the factory’s delivery point.
The IEA HPT Project 68 database, whose tables were updated on 10 July 2026, brings together technologies and demonstrations. Some declared supply temperatures reach 300 °C, with differing designs and levels of maturity. The page states that information supplied by participating manufacturers and institutes is not validated by a third party. This inventory allows initial selection; it certifies neither competitive cost at that temperature nor guaranteed availability for every site.
For a shortlisted offer, comparing the required point with the test map makes the discussion concrete. If the factory must run mainly at part load and the offer shows only a nominal point, the unresolved question concerns that operating mode. If tests cover the useful point but auxiliaries remain excluded from the heat price, the question concerns the service boundary. Asking for “more evidence” without identifying the gap advances the project less than a precisely targeted request for a test or calculation.
## Compare the alternatives
Direct heat recovery is often the first alternative to examine. If a stream can already heat another use through a heat exchanger, adding a temperature lift may be unnecessary. The balance then includes capture, transport, maintenance and any supplementary heating. A favourable available temperature does not remove the need to check distances and contamination risks, but it may avoid the compressor and its consumption.
An electric boiler differs in its independence from the waste-heat stream: it converts electricity into heat without relying on a source of recovered heat. This independence can simplify some situations, particularly intermittent demand or supplementary heating. It does not give it the same electricity consumption as a well-matched heat pump. The comparison must therefore consider energy, connected electrical capacity, investment, availability and flexibility together. An option that is simpler to integrate can remain less attractive for supplying a regular thermal base load.
Hydrogen requires a comparison across the chain. When it is produced from electricity and then used for heating, production, conditioning and use all consume energy. That sequence must be justified by a constraint that direct electricity or heat recovery cannot satisfy. It should not be chosen solely because one fuel can replace another. The origin of hydrogen and the industrial service remain decisive, as the guide to [low-carbon hydrogen (in French)](https://pnebbula.com/guides/hydrogene-bas-carbone-pourquoi-la-couleur-ne-suffit-pas/) explains.
Some operations can also change their heating method or reduce their thermal demand. The DOE presents a portfolio of process-heat solutions, including electrotechnologies and process changes. This is a useful reminder: the best question is not always how to replace the boiler on a like-for-like basis. Changing the process may, however, require more extensive product qualification and a longer industrial shutdown. These consequences must enter the comparison alongside energy consumption.
| Option to examine | Favourable condition | Main dependency | Essential comparison |
|---|---|---|---|
| Demand reduction | Avoidable losses or an adaptable process | Product quality and throughput maintained | Service and output after the change |
| Direct recovery | Source sufficiently hot and synchronised | Heat exchangers, distance, cleanliness of streams | Heat delivered and auxiliaries |
| Electric heat pump | Compatible temperature lift and regular demand | Source, electrical grid, integration | System COP under actual operating modes |
| Vapour recompression | Reusable process vapour | Composition, pressure, process operation | Overall balance, start-up and supplementary heating |
| Electric boiler | Demand or supplementary heating without a suitable thermal source | Connection and electricity price | Total cost and electrical demand |
| Alternative fuel | Constraints that other options cannot meet | Availability, origin, safety and infrastructure | Energy chain and emissions for an identical service |
## Calculate a scenario
This entirely fictional scenario shows how to calculate energy expenditure per unit of useful heat. It describes neither a market tariff nor an existing installation. Annual demand is 10,000 megawatt-hours, or MWh, at the same delivery point for all three solutions. The heat pump meets all demand here, with a constant assumed machine COP of four and an additional 250 MWh of electricity for auxiliaries. The model neglects other thermal losses and assumes that auxiliaries do not contribute to the useful heat delivered.
The gas boiler has an assumed efficiency of 0.90 and the electric boiler 0.98. Their auxiliaries are not modelled separately, whereas those of the heat pump are. This simplification prevents the table from being used as a complete comparison of real offers: their boundaries would first have to be aligned. The efficiencies are assumptions, and the basis on which the fuel is measured must be consistent. Financing, maintenance, shutdowns and connection costs do not enter this first calculation.
The compressor requires 10,000 divided by four, or 2,500 MWh of electricity. Adding auxiliaries brings system electricity consumption to 2,750 MWh. System COP is therefore 10,000 divided by 2,750, or about 3.64. At machine level, 7,500 MWh come from the source and 2,500 from electrical work. This distinction makes the balance traceable rather than leaving only its result. It also shows why advertising a machine COP of four would overstate performance within the wider boundary chosen here.
With assumed prices of 100 euros per MWh of electricity and 40 euros per MWh of gas, the heat pump costs 27.50 euros in energy per MWh of useful heat. The gas boiler requires about 11,111 MWh of fuel to provide the same service, or about 44.44 euros per useful MWh. The electric boiler consumes about 10,204 MWh, or about 102.04 euros per useful MWh. The annual results below are rounded: extra decimal places would not make the assumptions more reliable.
| Quantity in the fictional scenario | Electric heat pump | Reference gas boiler | Electric boiler for comparison |
|---|---:|---:|---:|
| Annual useful heat | 10,000 MWh | 10,000 MWh | 10,000 MWh |
| Conversion assumption | Machine COP 4 + auxiliaries | Efficiency 0.90 | Efficiency 0.98 |
| Electricity | 2,750 MWh | Auxiliaries not modelled | About 10,204 MWh |
| Gas | None | About 11,111 MWh of fuel | None |
| Assumed price | €100/MWh of electricity | €40/MWh of fuel | €100/MWh of electricity |
| Annual energy expenditure | €275,000 | About €444,000 | About €1,020,000 |
| Expenditure per unit of useful heat | €27.50/MWh | €44.44/MWh | €102.04/MWh |
*Teaching assumptions, without observed prices. Boiler auxiliaries are not itemised; other project costs are excluded.*
### Find the economic crossover point
The table becomes useful for decisions when its inputs are varied. With gas at 40 euros per MWh, reference gas expenditure reaches about 444,444 euros before rounding. Dividing that amount by the heat pump’s 2,750 MWh of electricity gives an electricity price of about 161.6 euros per MWh at equality. Above that price, the heat pump loses its advantage on energy expenditure alone, if performance and all other assumptions remain unchanged. This threshold is neither a contractual price nor the investment’s break-even point.
Performance provides another way to reason. The system COP needed for equal expenditure is the boiler efficiency multiplied by the ratio of the electricity price to the gas price. At the initial prices, that is 0.90 multiplied by 100 over 40, or 2.25. The fictional system COP of 3.64 is higher: the advantage on energy expenditure is consistent. If gas falls to 20 euros per MWh while electricity is unchanged, the required COP becomes 4.5. The same heat pump then loses its advantage. Its physics has not changed, but the economic value of the energy displaced has.
This sensitivity separates two decisions. A good margin on energy can justify continuing the study without yet justifying construction. To decide whether to invest, connection, installation, maintenance and supplementary-heating costs must still be examined, together with their timing and the process’s operating life. Availability of the source can also change the annual coverage rate. Including these items in a documented scenario makes the robustness of an offer open to discussion; applying the energy difference in the table over an arbitrary duration would produce a misleading payback time.
## Separate energy, money and emissions
Lower purchased energy consumption, financial savings and lower emissions are three distinct results. Electricity can cost more per unit of energy than gas while the heat pump consumes a smaller quantity of it. The climate balance depends on still other factors. The three readings should therefore be presented separately and their links explained, rather than allowing the best indicator to stand for the whole project.
To calculate operating emissions, multiply each consumption by a documented factor, specifying country, period, boundary and method. A combustion factor cannot be compared directly with a factor covering a whole chain. An annual average answers a different question from an analysis of operating hours or the marginal consequences of a new use. None of these conventions should be chosen only because it produces the most favourable result.
Working fluid, leakage, equipment manufacture and replacements can also change a wider comparison. Including them does not mean they necessarily dominate the balance. It means that a claim covering the whole life cycle must actually cover that life cycle. The Pnebbula guide to [life-cycle assessment (in French)](https://pnebbula.com/guides/analyse-du-cycle-de-vie-comparer-deux-technologies-sans-deplacer-le-probleme/) provides the framework: the same service, the same boundaries and identified transfers of impact.
For this reason, the preceding economic scenario is not assigned a universal decarbonisation percentage here. The quantity of fuel avoided can be calculated under its assumptions; the climate effect requires additional factors. In a real project, those factors may support a robust result or a substantial reservation. That reservation does not turn energy performance into an error. It simply shows that the question has changed and the corresponding evidence is needed before reaching a conclusion.
## What the Transpac case allows us to conclude
Maturity is assessed for an application: temperature, power, load, fluid, integration and maintenance resources. An offer reaching a high level in one demonstration does not become a universal reference. The Project 68 tables show this diversity. Conversely, a limit taken without its date from an older report does not necessarily describe current offers. The task is to find a case close enough to inform the project’s interfaces, then identify what still needs qualification.
On its Transpac page, updated on 14 October 2025, EDF describes a demonstrator at the WEPA Greenfield paper mill. Commissioned in April 2023, it underwent a reported nine-month experimental phase starting on 1 August 2023. EDF reports a machine COP between 3.6 and 4.2, averaging four. This is an industrial operating result declared by the project owner, without independent replication established by this source.
Transpac mainly illustrates a difference in design. The page explains a transcritical cycle that releases heat without condensation on the hot side. It uses a stream heated from 97 to 138 °C to illustrate this principle. That pair must not be presented as the source and delivery temperatures of the test that yielded the average COP of four: it describes the two ends of one heated stream in the explanation. This page alone does not supply the full conditions linking each COP to the source temperature.
The source thus reports industrial integration of this design and performance monitoring. For a similar dryer, the useful questions then concern thermal profiles, auxiliaries, downtime and service quality. The source alone does not provide a guaranteed total cost, an annual COP for the entire system or availability across multiple sites. Those items would be needed to turn the technical example into a basis for economic comparison at another factory.
## Prepare the evidence
The measurement plan begins with a map of interfaces: flow rate and temperatures on the source side, heat at the delivery point, electricity for the compressor and the auxiliaries included. Each measurement is assigned a location, period and accuracy. The factory’s overall electricity meter does not always isolate the heat pump, especially if production changes at the same time. An estimate can fill a missing measurement, provided it remains identifiable as an estimate in the final balance.
The reference for comparison must also correspond to what will actually disappear. If a boiler remains on for another workshop, replacing part of its output does not eliminate all its fixed losses. Assigning it an average efficiency and then crediting the heat pump with all avoided losses could overstate the benefit. The project file must explain the boiler’s remaining operation, the services it retains and how shared consumption will be allocated.
The performance map then connects test points to expected operating modes. For a factory often running at part load, a nominal point does not cover the need for evidence. For a highly variable source, the range of temperatures tested becomes central. The offer must distinguish areas derived from measurements, validated calculation and extrapolation. The map helps select a useful missing test, rather than indiscriminately demand more data on the whole machine.
Before installation, the parties finally agree on an acceptance protocol: representative conditions, instruments, uncertainties, indicators and handling of deviations. The Annex 58 recommendations distinguish laboratory testing from on-site testing. The grid below uses their principles to organise the discussion. It sets no regulatory or contractual threshold; commitments and installation safety criteria are matters for the competent parties in the actual project.
| Proposed evidence stage | Question to resolve | Evidence expected | Reason for review |
|---|---|---|---|
| Define the service | What exactly is being replaced? | Delivery point, temperatures, profiles and baseline | Changed demand or ambiguous boundary |
| Characterise the streams | Do source and demand coincide? | Synchronised series and description of effluents | Insufficient or inaccessible resource |
| Compare the options | Can a simpler solution meet demand? | Balance for an identical service, with costs separated | Direct recovery or lower demand preferable |
| Qualify the machine | What is performance in the expected modes? | Tests, map and model limits | Useful operating area mainly extrapolated |
| Accept on site | Do the service and consumption match the agreement? | Measurements, uncertainties and explained deviations | Unresolved deviation or unrepresentative conditions |
| Monitor operation | Does the benefit persist? | Energy, availability, maintenance and events | Drift, loss of source or degraded quality |
### Keep acceptance and monitoring distinct
Acceptance checks an agreement under the conditions specified. Monitoring observes what happens afterwards as production campaigns, local weather or demand change. The two approaches should share consistent measurements without claiming to answer the same question. Successful acceptance does not remove the need to monitor operation; a later variation does not automatically establish a machine defect if its inlet conditions have changed.
A change log helps interpret the results: a modified heat exchanger, a moved sensor, a new production recipe, a shutdown of the source workshop or a control correction. These events sometimes explain more than an isolated curve. The log should not become a purposeless collection. Each review should connect useful energy, operating conditions and interventions, then lead to a documented decision to continue, correct or investigate further.
## Operate without making production fragile
Heat recovery creates a relationship between two functions that could previously operate independently. An incident on the source side can affect the demand it supplies. A change in recipe or throughput can shift performance. That dependency must be visible in daily operations. It does not mean the project is bad; it means teams must know the consequences of each shutdown and which equipment takes over the service.
The backup strategy starts with how critical the process is. Some uses tolerate a temporary temperature drop; others require strict continuity. The fallback mode, its start-up time and limits must be described. Retaining supplementary heating should not lead to ignoring its consumption or ending its maintenance. Backup equipment available on paper may be missing when both the heat pump and source are unavailable.
Maintenance must be involved from the design stage. Heat exchangers must remain accessible, cleaning operations must fit shutdowns and critical parts must be identified. The choice of working fluid entails safety, skills and maintenance constraints that relevant professionals must qualify. Calling it “natural” or “new” does not establish its suitability. A thermodynamically attractive solution can become unsuitable if the site cannot maintain it under its actual conditions.
Monitoring must ultimately enable correction. Observing COP drift without checking temperatures, flow rates and load can lead to the wrong diagnosis. A fall can come from a colder source, a fouled heat exchanger or changed demand. These causes do not call for the same action. The operating plan must therefore connect indicators to practical checks and specify who can stop the machine when process quality, safety or continuity is no longer assured.
## France and Europe
An industrial heat pump can help reduce a site’s dependence on imported fuels, but it shifts some dependencies towards electricity and equipment. Greater autonomy is not defined solely by the manufacturer’s origin. Access to the grid, compressors, fluids, maintenance and integration skills must be examined. This is a chain analysis, to be conducted with the same care as for other industrial technologies.
The electrical connection deserves an early study. A heat pump can reduce purchased energy while increasing the electrical power drawn at the site. Lead times, available capacity and required works cannot be inferred from the national situation. The guide to [the electrical grid and technology projects (in French)](https://pnebbula.com/guides/pourquoi-le-reseau-electrique-peut-retarder-un-projet-technologique/) helps distinguish an overall energy resource from capacity actually accessible at a particular place and date.
The European interest lies partly in the possibility of integrating recovery into existing industrial systems. This can make use of process expertise and reduce some fuel purchases. That potential does not establish a systematic economic advantage. Tariff structures, electrical profiles, heat networks and factory constraints vary. The IEA’s 2022 report provides dated context for the possibilities, not a survey of installed capacity or costs observed in November 2026.
Public funding must not be assumed. When consulted on 9 November 2026, the ADEME 2026 scheme for waste-heat recovery showed the aid as closed and new applications to the Fonds Chaleur as suspended. This observation concerns that scheme, without a general conclusion about all programmes. The prudent approach is first to calculate a project without assumed aid, then include only support whose conditions and availability have actually been checked.
## Decide between measuring, studying, testing and investing
A useful decision names the next action and what it must resolve. When the source, demand or responsibility for the service is unknown, the priority is targeted data collection: instrument the stream, specify setpoints or assign responsibility for the measurement point. At this stage, launching a substantial heat-pump experiment risks testing a machine without knowing the service it must provide. Preliminary measurements can also reveal simpler direct recovery or demand reduction.
Once those data have been gathered, the opportunity study compares solutions for an identical service. It examines hours, temperatures, alternatives and electrical interfaces. Its result may be a heat pump, another solution or a postponement. In the fictional case of the two offset shifts, it must establish the value of four hours of overlap and what storage would contribute. In the economic case, it must check whether the price and performance assumptions leave enough margin to carry the other costs.
A heat-pump trial comes when a remaining uncertainty can change the choice: behaviour of a fouling effluent, part-load performance or ability to follow transitions. Before it starts, it is assigned a question, duration, instruments and decision criterion. A successful test at a favourable point does not resolve a grid interface that is still unknown. Its result must address the risk that justified the expenditure and disruption to the workshop.
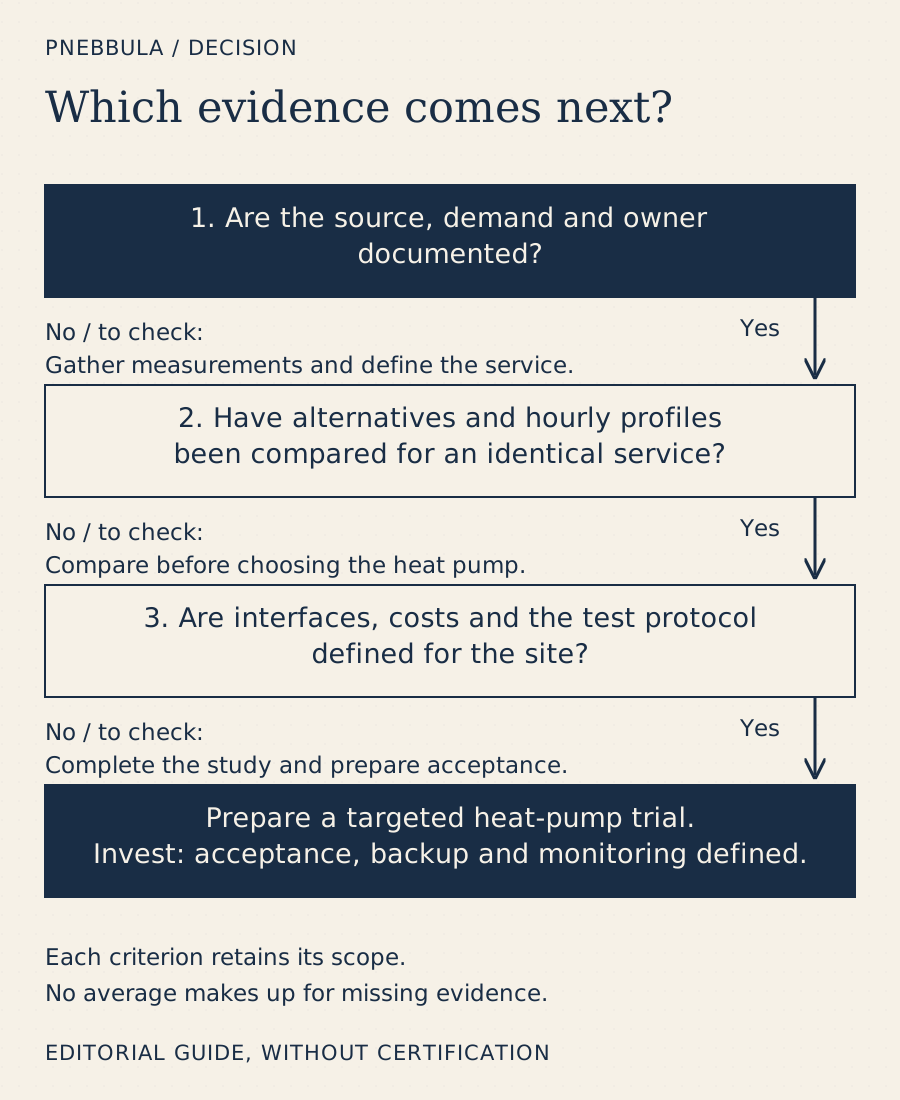
*Each stage prepares a different commitment. A complete file does not remove the need to decide on the actual offers and conditions of the site.*
Investment finally requires a defined solution, total cost, agreed acceptance and an organisation for maintenance and backup. A future fall in activity, a recipe change or another project eliminating the waste stream can still change sizing. These events must trigger a review rather than be absorbed into an old assumption. An industrial heat pump is relevant when it connects a thermal resource durably to a real demand; measurements, the contract and operation must maintain that same relationship.
## Self-assessment questionnaire
This tool collects no data and is not a scientifically validated instrument. Answer “Yes”, “No” or “To check” on the basis of identifiable evidence, not an impression. Responses organise the next checks without an overall score.
1. Is the heat source identified, characterised and available according to a known schedule?
2. Is heat demand defined at the delivery point, including temperatures, power, energy and production schedule?
3. Has a person responsible for the heating service, its measurements and its shutdown conditions been named?
4. Do measurements allow source and demand to be aligned in time, including start-ups and shutdowns?
5. Have demand reduction, direct recovery and other solutions been compared for an identical service?
6. Does the calculation distinguish energy, investment, operation and price assumptions, without assuming aid?
7. Have connection capacity and site interfaces been checked for the electrical power required?
8. Do a performance map and a test protocol define the useful operating modes, boundaries and uncertainties?
9. Are maintenance, backup and responses to source failure or inadequate thermal quality organised?
10. Are a review date, responsible people and criteria for continuing, correcting or stopping defined?
## Read the answers and choose the next action
If any answer to questions 1 to 3 is “No” or “To check”, begin with the prerequisites: characterise the source, formalise demand or assign responsibility for the service. This gap prevents recommending a substantial heat-pump trial on that basis alone. Targeted measurement remains possible and is precisely the next step.
If these prerequisites are documented, questions 4 to 8 organise the opportunity study and preparation of a trial. Poorly known simultaneity calls for synchronised profiles; an absent comparison calls for examining alternatives; an uncertain connection calls for a study of the electrical interface. The trial must then reduce a decisive uncertainty, with explicit conditions and a decision criterion. It does not replace a feasibility dependency that remains unanswered.
Questions 9 and 10 concern operation and governance of the decision. Missing maintenance, backup or review criteria must be resolved before the corresponding commitment. Ten positive answers mean that the evidence is organised for a decision; they establish neither guaranteed profitability nor automatic approval to buy. The questionnaire must be repeated when production, the source or price assumptions change.
## Checklist for a usable study
- Describe the heating service and its owner at the delivery point.
- Synchronise source and demand profiles and identify streams to preserve or treat.
- Examine demand reduction, direct recovery, heat pumps and other relevant options.
- Align the boundaries of the consumption, costs and emissions being compared.
- Connect claimed performance to its tests, conditions and limits.
- Plan acceptance, maintenance, backup and stop criteria before committing.
- Record the decisive unknowns and schedule the decision review.
## Sources and verification scope
Research and reading were carried out on 9 November 2026. Primary sources were prioritised: IEA, the IEA HPT programme, ADEME and DOE. The Transpac case comes from the industrial project owner, EDF, and remains identified as such. Links appear close to the statements they support. The scenario and questionnaire are teaching constructions; the industrial case retains the scope reported by EDF.